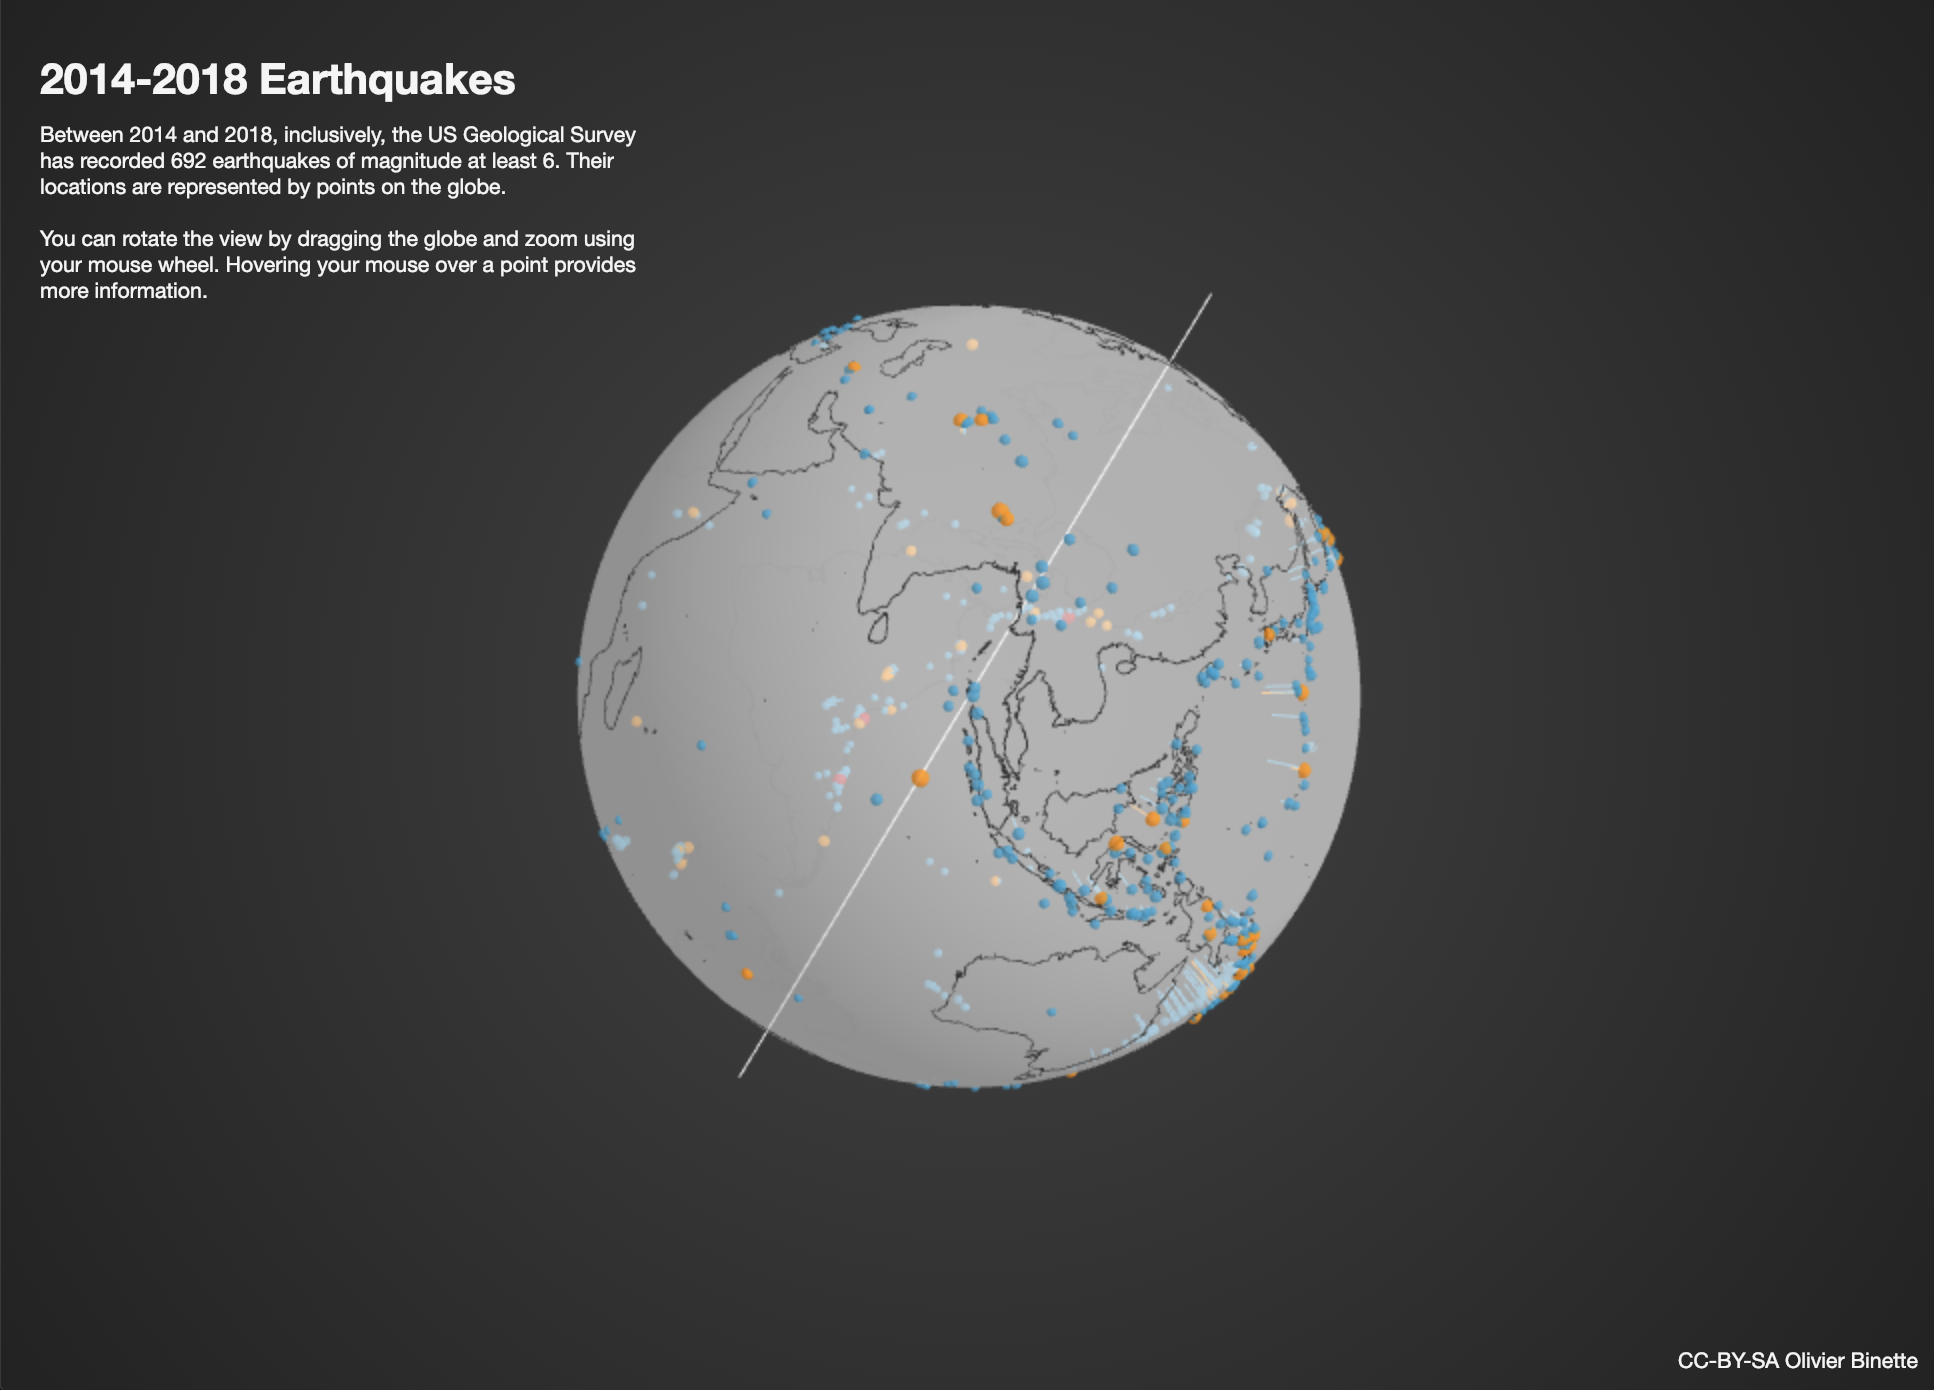
Applet to visualize the positions and depths of earthquakes of magnitude greater than 6 from January 1st 2014 up to January 1st 2019. Data is from the US Geological Survey (usgs.gov). Code is on GitHub.
The original motivation was to make a web tool for high-dimensional data exploration through spherical multidimensional scaling (S-MDS). The basic idea of S-MDS is to map a possibly high-dimensional dataset on the sphere while approximately preserving a matrix of pairwise distances (or divergences). An interactive visualization tool could help explore the mapped dataset and translate observations back to the original data domain. To be continued…